
3D charts
Holochart draws Plotly's 3D traces, and a 3D bar trace of its own, in scenes: 3D subplots with a camera you turn, zoom and pan, three axes on the walls of an axis box, lights and hover. Every 3D trace is drawn on the GPU with three.js: orbiting only moves the camera, and each trace is one or a few draw calls whatever its size.
Chart types
| Chart | Trace type | Use it for |
|---|---|---|
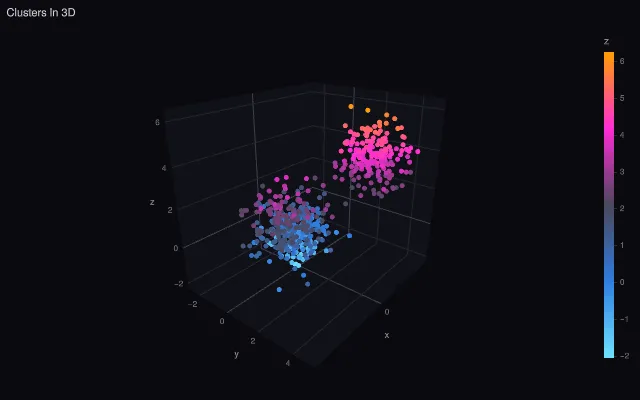 | scatter3d | Points, lines and labels at x, y, z |
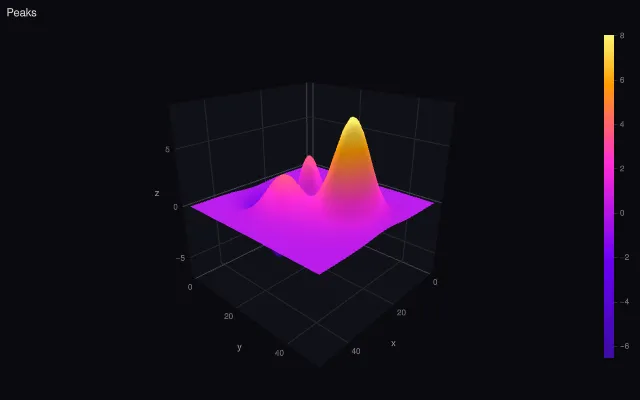 | surface | A height field over an x–y grid, with contours |
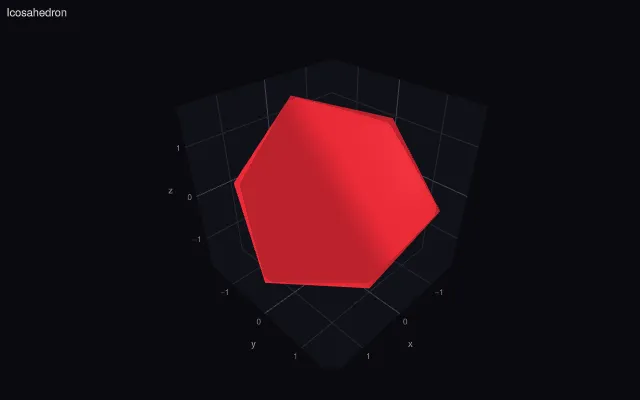 | mesh3d | Triangle meshes: given, or derived hulls and Delaunay |
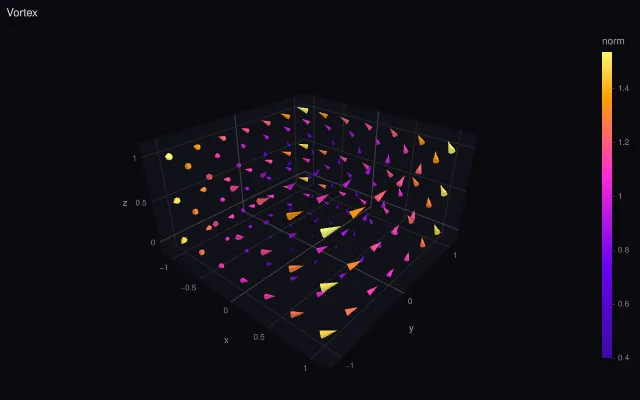 | cone | Vector fields as cones at sample points |
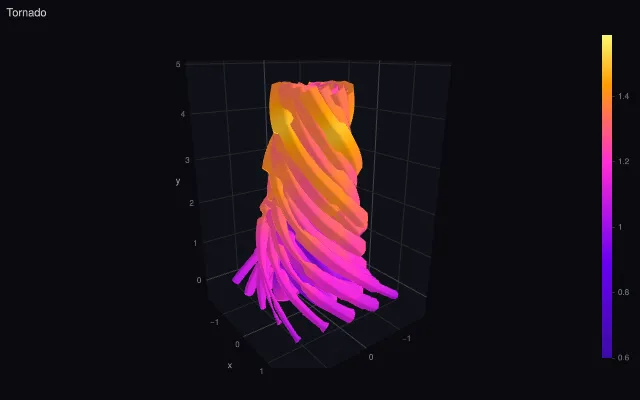 | streamtube | Flow lines through a vector field, as tubes |
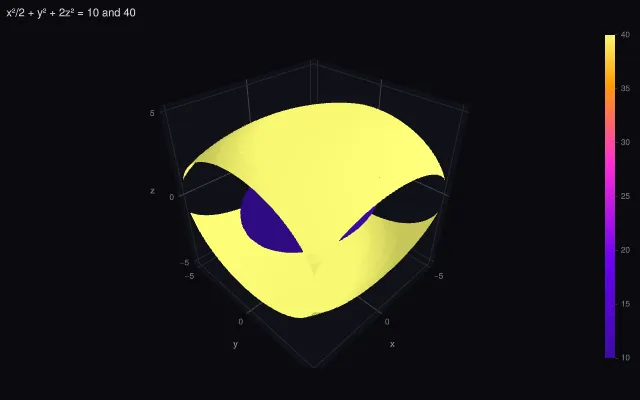 | isosurface | Surfaces of equal value in a 3D grid |
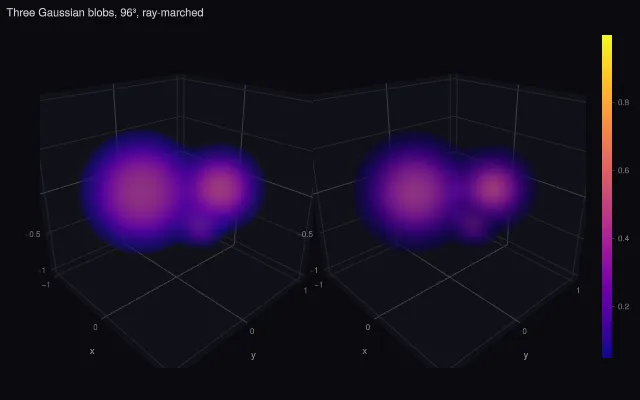 | volume | A whole 3D grid: stacked isosurfaces or ray marching |
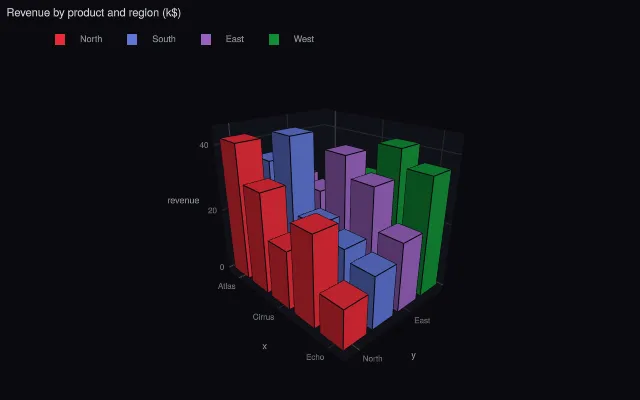 | bar3d | 3D bars on an x–y grid (a Holochart extension) |
From tabular data, Express builds scatter3d figures with hx.scatter3d and hx.line3d (Plotly Express's px.scatter_3d and px.line_3d). Every 3D example is in the gallery (filter "3D-native").
Scene basics
A 3D trace draws in layout.scene unless it names another (scene: 'scene2'). The 3D scenes page covers what every scene has:
- Camera:
scene.camera(eye,center,up) and a perspective or orthographic projection, in Plotly's units, with animated camera moves and auto-rotation. - Aspect ratio:
scene.aspectmode(auto,cube,data,manual) andaspectratio(details). - Axes:
scene.xaxis,yaxis,zaxiswith linear, log, date and category types, ranges, ticks, grids and the walls behind them (details). - Controls: turntable or orbit drags, wheel zoom, pan, touch gestures and double-click to reset (details); camera moves emit
relayout. - Hover: markers and lines are picked on the GPU, respecting depth; labels follow Plotly's 3D hover, with spikes to the walls and scene annotations (details).
- Lighting and materials: Plotly's
lightingandlightpositionon every lit trace, plus three.js materials (material) and scene light rigs (scene.lighting) with shadows and environment maps (materials & lighting). - Several scenes:
scene2,scene3, … side by side, next to 2D subplots in a grid (details).
scene/subplotsPerformance
3D traces keep their data on the GPU and redraw only when something changes. The numbers below come from the chart pages, measured on an Apple M1 Max; frame rates with pnpm bench:gpu (headless Chromium on the real GPU, see GPU benchmarks for the method; CI renders with software GL and can't measure them):
| Trace | Size | Measured |
|---|---|---|
scatter3d | 1,000,000 markers | orbits interactively; one draw call per part (markers, lines, text) |
surface | 1024 × 1024 grid | 60 fps orbit; new heights of the same size in about 40 ms |
volume | 256³ grid, ray-marched | 60 fps orbit (about 6.5 ms GPU per frame); first draw about 0.5 s |
isosurface | 64³ grid, two surfaces | about 0.15 s to extract 350,000 triangles on the CPU |
mesh3d | 10,000 points, delaunayaxis | triangulated in about 50 ms (convex hull under 10 ms) |
- Opaque markers, lines and meshes draw in any order. Translucent ones are sorted as the camera moves (up to 200,000 markers or 500,000 triangles), so keep
opacity: 1on the largest traces. - CPU work happens once per data change: isosurface and volume extraction, streamtube integration, derived meshes and tubes. Camera moves cost nothing on the CPU.
- The 3D render code (meshes, 3D lines and markers) loads lazily the first time a scene needs it, so 2D charts never pay for it;
chart.readywaits for it. - Each page's Performance notes has the details; the performance guide covers large data in general.
Script tag
@mk7s/holochart includes the 3D scene and traces. The script-tag build is split: the main holochart.iife.min.js is 2D only, and the 3D add-on holochart-3d.iife.min.js, loaded after it, registers the scene and every 3D trace into window.Holochart using the main script's three.js:
<script src="https://cdn.jsdelivr.net/npm/@mk7s/holochart/dist/holochart.iife.min.js"></script>
<script src="https://cdn.jsdelivr.net/npm/@mk7s/holochart/dist/holochart-3d.iife.min.js"></script>
With npm and partial bundles, register the 3D package yourself: register(...traces3d) from @mk7s/holochart-traces-3d (the list includes the scene). See Installation.
Differences from Plotly
Attribute names and defaults follow Plotly's 3D traces and layout.scene, so Plotly figures render as they are. The main differences, with the full lists on each page:
| Trace or topic | Differences |
|---|---|
| Scenes | Upright billboard labels; double-click resets the camera; animateCamera, autorotate and scene.lighting are extensions |
| scatter3d | Sphere markers, tube and ribbon lines are extensions; projections are sprites; no programmatic 3D hover yet |
| surface | Grids drawn as given (no refinement); wireframe and material are extensions; contour levels follow the axis ticks |
| mesh3d | Derived triangles use the trace's own span; %{intensity} in hover; no mesh file loaders yet |
| cone | Sizes from the trace's own span; colors map the norm directly |
| streamtube | RK4 integration (curved flow followed accurately); colors use the actual norm |
| isosurface | Plotly's triangles, with corner and descending-axis fixes; hover snaps to the nearest grid point |
| volume | Plotly's stacked isosurfaces by default; ray marching (render: 'raymarch') is an extension |
| bar3d | Not a Plotly trace; stacking per stackgroup, no grouped mode |
| Materials & lighting | material and scene.lighting are extensions; Plotly's lighting model is the default |
Related pages
- 3D scenes: camera, axes, controls, hover, spikes and annotations
- Materials, lighting & effects: materials, lights and translucency
- Express 3D charts:
scatter3dandline3dfrom tables - Camera animation and transitions